What is thermography?
Temperature measurement vs. thermography
Thermography is often confused with temperature measurement. Although both cases involve heat, the methods of measurement are completely different.
Measuring temperatures with a thermometer requires the sensor to always be in direct contact with the object being measured. For example, a fever thermometer must be in contact with the body in order to measure a person’s temperature.
This principle also applies to electronic temperature measuring instruments: by being in contact with the object being measured, the sensor takes on the object’s temperature and generates voltage through electrophysical means. The temperature is then calculated and displayed.
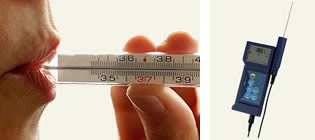
Thermography, on the other hand, uses a different physical principle and does not require direct contact.
Thermal imaging cameras can then be used at greater distances to measure temperatures (see figure). This opens up interesting application options.
Thermography – visual representation of temperatures
Thermography is an imaging technique for “visualizing” the surface temperatures of objects. A thermal imaging camera can graphically display temperatures by measuring the emitted thermal radiation (more precisely: infrared radiation) from surfaces and using this to calculate a temperature. Humans cannot see infrared radiation, but under certain circumstances they can sense it. Try this little experiment:
Move your hand to within a few millimeters of the area on the side of your head between your ear and cheek. Depending on the temperature of your hands themselves, you will feel a sensation of warmth or cold. Your sensory system evaluates the radiant energy emitted by your hands at least to the point where you can tell if your hand is warmer or colder.
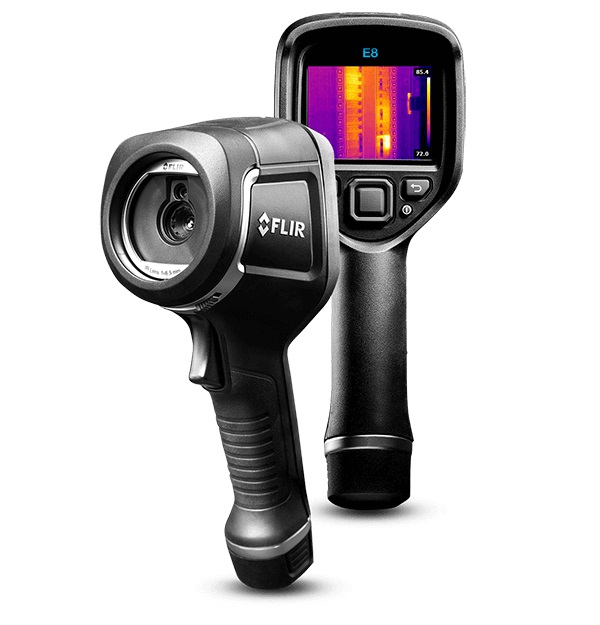
In principle, a thermal imaging camera does nothing different, but it is far more sensitive and has considerably greater spatial resolution than the human infrared sensor system.
You are sure to have seen thermographic images before, for example, the “infamous” thermal images of poorly insulated houses. The colored temperature images instantly show where heat loss is occurring – and where it can be eliminated.
A book recommendation on the topic [in German]:
Leitfaden Thermografie im Bauwesen (external link)
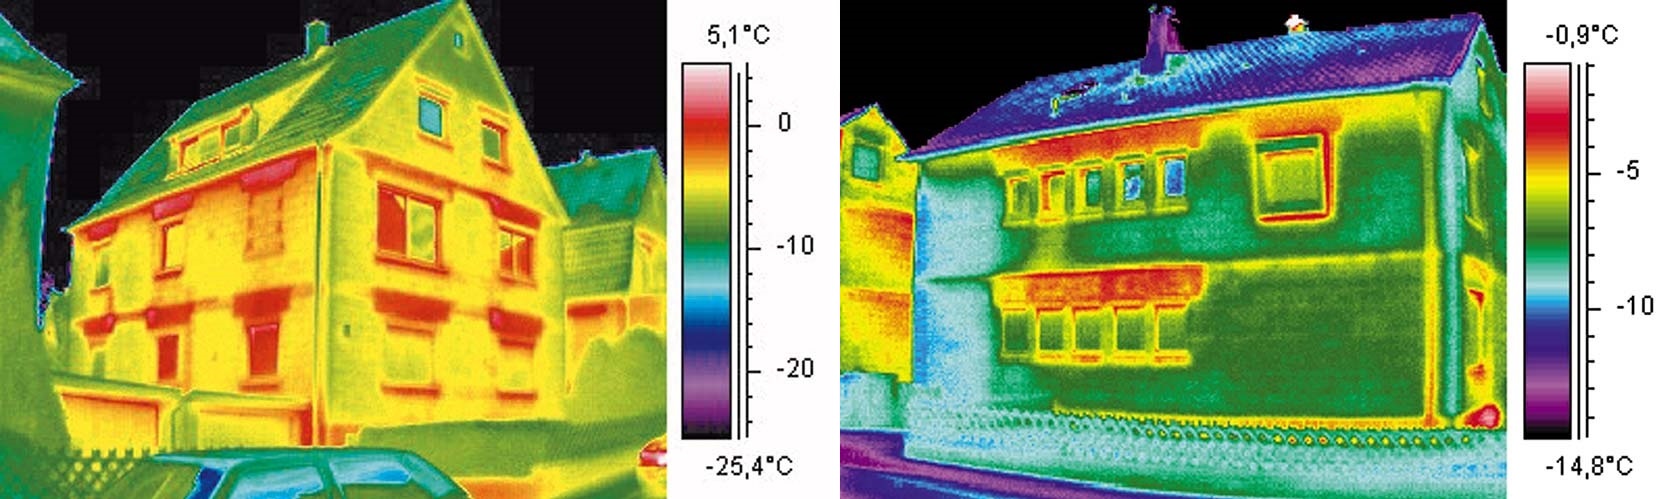
Thermographs of houses in typical false-color representation.
High-resolution thermographs of an entire storage area can be easily created in the application. Only locations with increased temperatures are colored in the image and therefore instantly identifiable.
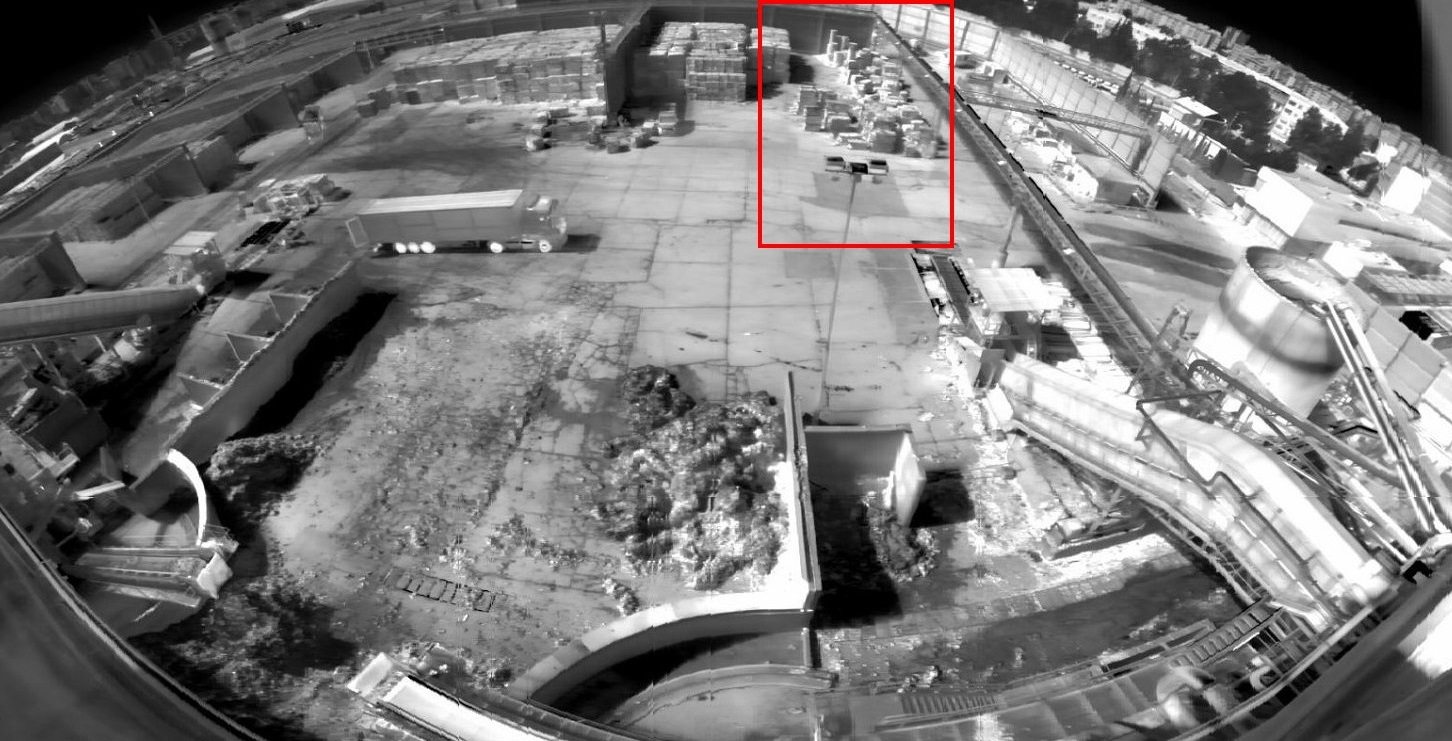
A thermal image of a large outdoor area, seamlessly and automatically made up of multiple individual images.
Infrared radiation is everywhere
Any material with a temperature above absolute zero (-273.15°C = 0 Kelvin) emits electromagnetic radiation. Its intensity and wavelength distribution depends on the temperature.
Certain ranges of the radiation spectrum can be detected as visible light by the human eye. For example, a piece of steel heated to 1,200°C appears to the human eye as incandescent white-yellow. As the steel cools, it looks increasingly darker and redder, and below about 550°C it ceases to “glow”.
Nevertheless, the material is always emitting radiation which we just do not see – infrared radiation. Modern infrared and/or thermal imaging cameras, such as those used by Orglmeister, detect infrared radiation at temperatures ranging from approximately -20°C to 1,200°C.
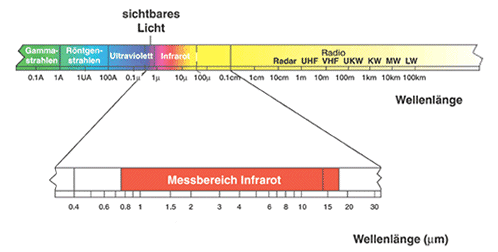
Electromagnetic spectrum: beyond visible red light is the infrared range.
More information about the history and physics of infrared radiation